The origin of the Turtle Diagram is not entirely clear. It is sometimes attributed to Philip Crosby, known for the Zero Defects concept, and at other times linked to Kaoru Ishikawa, creator of the cause-and-effect diagram. In practice, it is likely a tool that evolved over time, incorporating contributions from multiple quality professionals.
Regardless of its origin, the Turtle Diagram is one of the most widely used process mapping tools. It helps organizations understand key process factors and generate valuable improvement insights.
One of its main advantages is its simple visual structure, which makes it easy to use while enabling structured and comprehensive process analysis. Even with minimal training, professionals can apply the technique effectively.
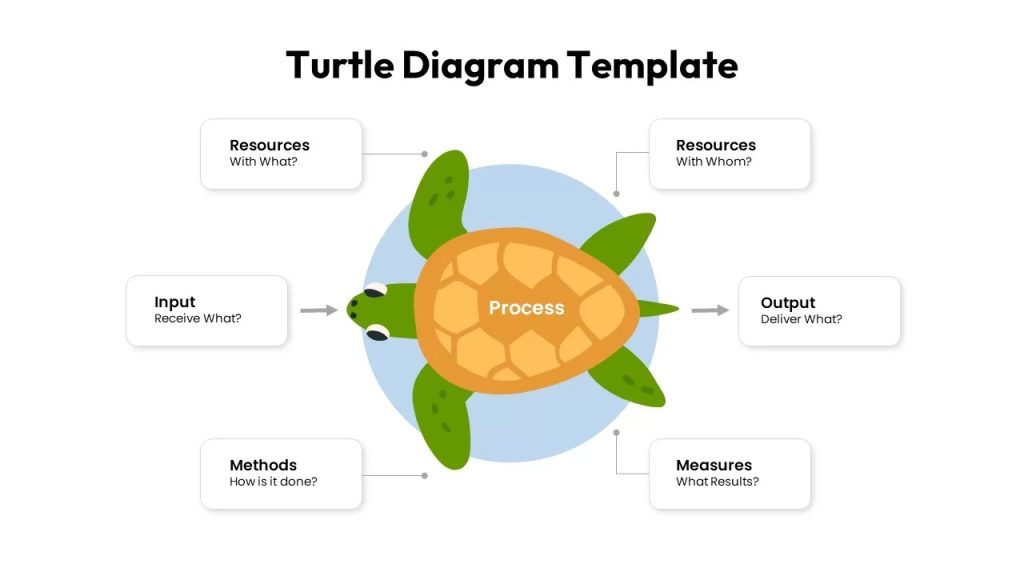
The diagram is based on six core elements:
- Process
- Inputs
- Outputs
- Human Resources
- Infrastructure Resources
- Indicators
Why is it called a Turtle Diagram?
These elements are visually arranged with the process at the center, surrounded by the other components. The final layout resembles a turtle, where the process forms the shell and the surrounding elements represent the head, legs, and tail—hence the name “Turtle Diagram.”
Process – the transformation core
The process is the central element of the diagram. It typically includes the process name, objective, and scope. It is also recommended to identify the process owner—the person responsible for overseeing and managing its execution.
Inputs – what feeds the process
Inputs are everything required for the process to begin, including information, raw materials, and requirements. The quality of inputs directly impacts the quality of outputs.
Outputs – what the process delivers
Outputs are the results generated by the process, such as products, services, or intermediate deliverables. They must align with the expected outcomes defined for the process.
Human Resources – who performs the process
This section identifies the people responsible for executing the process. It may also include required competencies, training, and backup personnel to address turnover or absence.
Infrastructure and Resources – what supports the process
This includes tools, equipment, systems, and other resources used during the process. Unlike inputs, these elements do not become part of the final output but are essential for process execution.
Indicators – how to measure performance
Indicators are used to monitor and evaluate process performance. This includes KPIs, targets, and metrics related to performance, compliance, and measurement systems.
Methods – how the process is performed
Some approaches also include methods (procedures, work instructions, standards, and legal requirements). While there is no universal agreement on where to position this element in the diagram, it is essential to include it in the analysis.
Turtle Diagram – no process without a system view
The Turtle Diagram is a key tool in the toolkit of any management systems professional. It is widely used in organizations, supplier evaluations, and audits.
It provides a simple, practical, and effective way to map and analyze processes. It helps identify gaps, supports audits, connects operations to strategic objectives, and improves employee engagement.
Its greatest value lies not only in completing the diagram but in the reflections it generates. Each element is essential—without one of them, the process cannot function effectively. The diagram transforms abstract processes into a visual and manageable structure, making continuous improvement more achievable.